ParkRunning and Crosstalking ! Interactive graphs + Linear Regression in R

Park Run Results : Brockwell park 10th June

I am currently in training for a 10km running race. As part of my training I have started doing the park run every saturday morning to get some speed practice. This saturday I did the Brockwell park run in south london and got my second fastest parkrun time of 26 minutes 47 seconds. Park run publishes the complete results each week showing the times of all finishers including details about their gender, age band and their personal best for the course. I decided to use this data to make some charts of the results this week.

Read more on my new website here!

This Blog is Moving!

Starting a new blog using ‘Blogdown’

Today is the official launch of my new blog – www.jennifersnape.com. I am saying goodbye to my platform here at wordpress in favour of a blog made using the R Studio blowdown framework. This is a for a few reasons, but mainly because it makes writing about programming code a lot easier and allows the analysis and blog to be integrated (without having to hop between R Studio and wordpress as I do at the moment!)

For more information on how I created my new blog : see my first post.

Continue reading This Blog is Moving!

Getting Started with RShiny

Interactive Visualisations in R

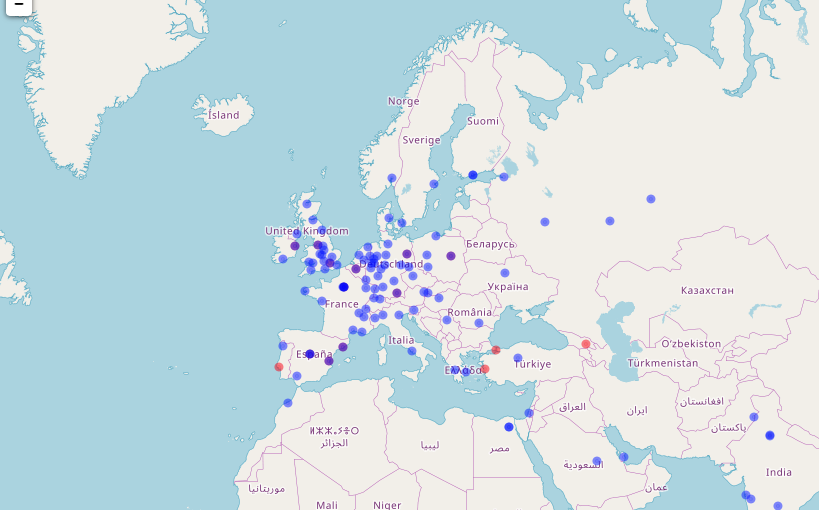
This post was inspired by this competition, hosted by JumpingRivers. The competition asks you to extract data from their GitHub account containing the details of R groups and R ladies groups around the world. With this data it asks you to create a visualisation, of any kind. I’ve been working on my visualisation skills in R so I thought I would have a go at entering.

Geographical data always works well plotted on a map and since there is a lot of information to visualise from all over the world, I decided to incorporate an element of interactivity. The easiest way to do this using R is through the RShiny package. Therefore this project was made up of 2 steps: extracting the data to get it in a form to be visualised and then creating an interactive Rshiny app showing the locations of the different groups on a map. Continue reading Getting Started with RShiny